Script detail
Back to Scripts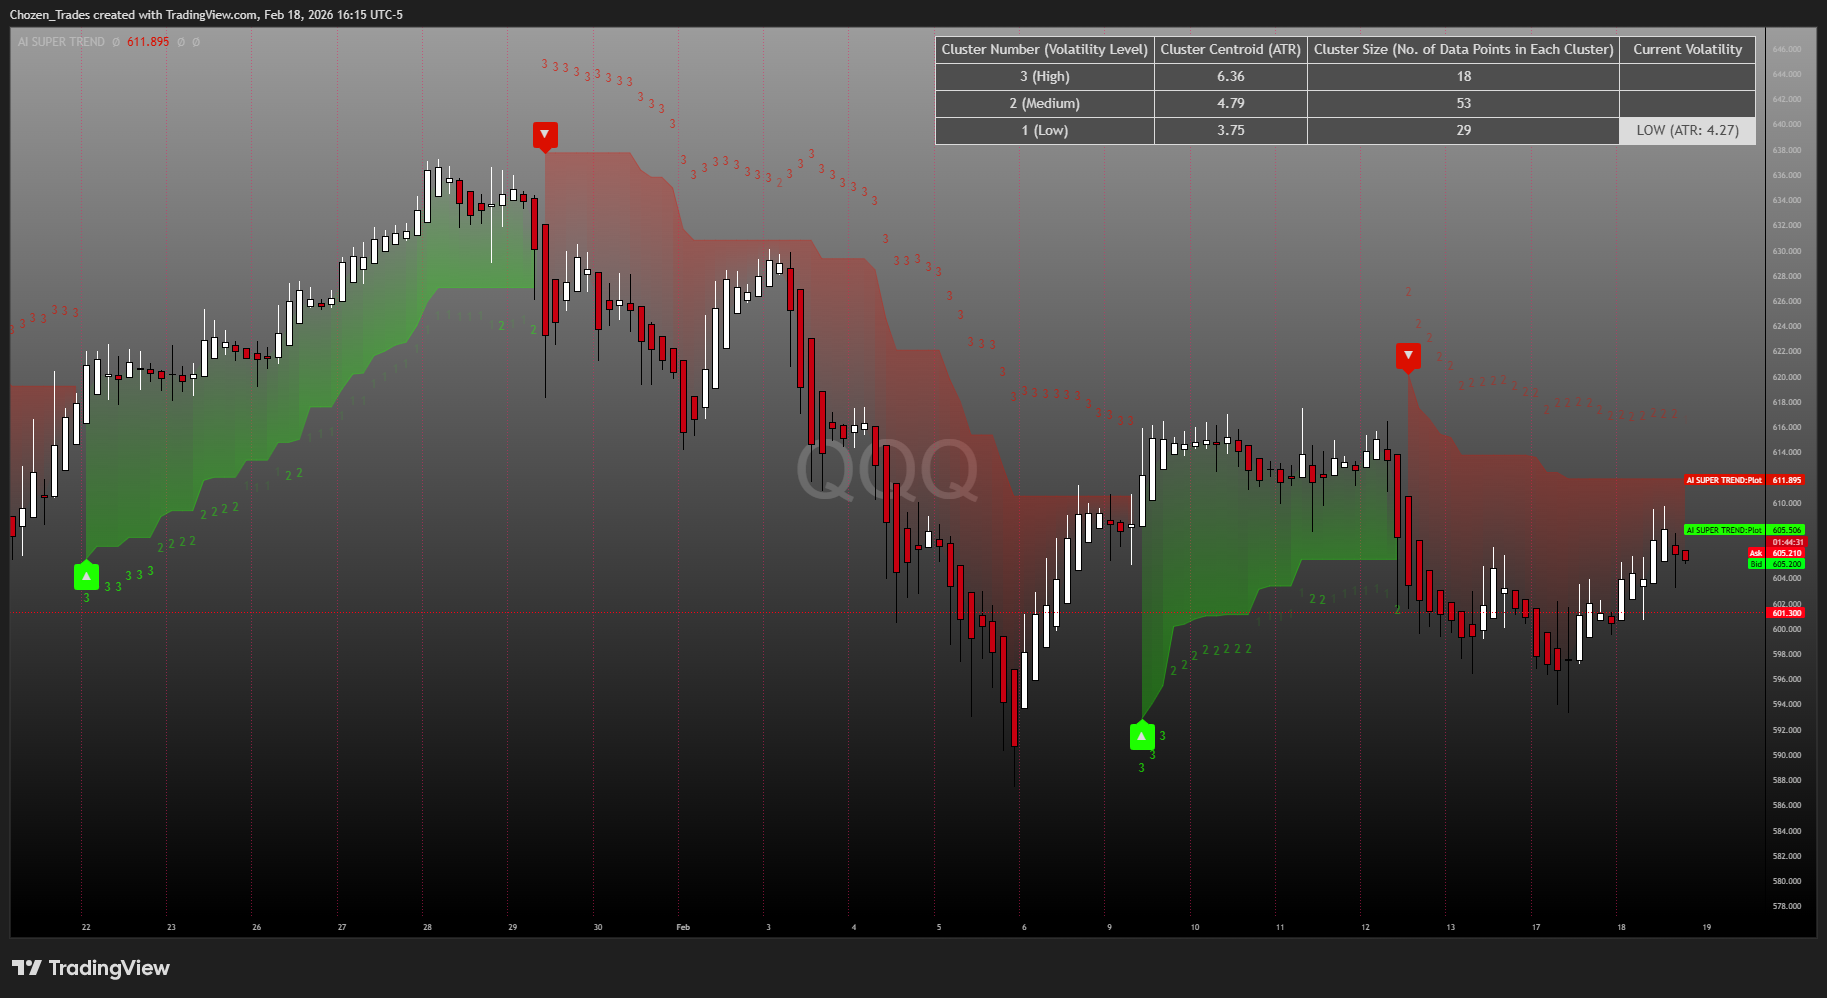
Published script
AI Super Trend
A self-adapting SuperTrend overlay that adjusts to changing volatility regimes using clustering on ATR behavior. Designed to keep trend direction “sticky” during noise and flip faster when volatility expands. Includes visual trend state + signal markers and alert conditions.
trendsupertrendvolatilityatradaptive
Code access
Select platform and load version history
The viewer, login gating, and install guidance all behave the same — this only updates the presentation to match the newer resources pages.
v1.0 · latest
// This Pine Script™ code is subject to the terms of the Mozilla Public License 2.0 at https://mozilla.org/MPL/2.0/
// © ChozenTrades

//@version=5
indicator("Self Adapting Trend Chaser", "AI SUPER TREND", overlay = true, max_labels_count = 500)
import TradingView/ta/7
atr_len = input.int(10, "ATR Length", group = "SuperTrend Settings")
fact = input.float(3, "SuperTrend Factor", group = "SuperTrend Settings")
training_data_period = input.int(100, "Training Data Length", group = "K-Means Settings")
highvol = input.float(0.75, "Initial High volatility Percentile Guess", maxval = 1, group = "K-Means Settings", tooltip = "The initial guess of where the potential 'high volatility' area is, a value of 0.75 will take the 75th percentile of the range of ATR values over the training data period")
midvol = input.float(0.5, "Initial Medium volatility Percentile Guess", maxval = 1, group = "K-Means Settings", tooltip = "The initial guess of where the potential 'medium volatility' area is, a value of 0.5 will take the 50th percentile of the range of ATR values over the training data period")
lowvol = input.float(0.25, "Initial Low volatility Percentile Guess", maxval = 1, group = "K-Means Settings", tooltip = "The initial guess of where the potential 'low volatility' area is, a value of 0.25 will take the 25th percentile of the range of ATR values over the training data period")
t1 = input.int(70, "Transparency 1", maxval = 100, minval = 0, group = "Appearance")
t2 = input.int(95, "Transparency 2", maxval = 100, minval = 0, group = "Appearance")
green = input.color(color.rgb(30, 255, 0), "Bullish Color", group = "Appearance")
red = input.color(#db0f00, "Bearish Color", group = "Appearance")

pine_supertrend(factor, atr) =>
    src = hl2
    upperBand = src + factor * atr
    lowerBand = src - factor * atr
    prevLowerBand = nz(lowerBand[1])
    prevUpperBand = nz(upperBand[1])

    lowerBand := lowerBand > prevLowerBand or close[1] < prevLowerBand ? lowerBand : prevLowerBand
    upperBand := upperBand < prevUpperBand or close[1] > prevUpperBand ? upperBand : prevUpperBand
    int _direction = na
    float superTrend = na
    prevSuperTrend = superTrend[1]
    if na(atr[1])
        _direction := 1
    else if prevSuperTrend == prevUpperBand
        _direction := close > upperBand ? -1 : 1
    else
        _direction := close < lowerBand ? 1 : -1
    superTrend := _direction == -1 ? lowerBand : upperBand
    [superTrend, _direction]

volatility = ta.atr(atr_len)

upper = ta.highest(volatility, training_data_period)
lower = ta.lowest(volatility, training_data_period)

high_volatility = lower + (upper-lower) * highvol
medium_volatility = lower + (upper-lower) * midvol
low_volatility = lower + (upper-lower) * lowvol

iterations = 0

size_a = 0
size_b = 0
size_c = 0

hv = array.new_float()
mv = array.new_float()
lv = array.new_float()
amean = array.new_float(1,high_volatility)
bmean = array.new_float(1,medium_volatility)
cmean = array.new_float(1,low_volatility)

if nz(volatility) > 0 and bar_index >= training_data_period-1

    while ((amean.size() == 1 ? true : (amean.first() != amean.get(1))) or (bmean.size() == 1 ? true : (bmean.first() != bmean.get(1))) or (cmean.size() == 1 ? true : (cmean.first() != cmean.get(1))))
        hv.clear()
        mv.clear()
        lv.clear()
        for i = training_data_period-1 to 0
            _1 = math.abs(volatility[i] - amean.first())
            _2 = math.abs(volatility[i] - bmean.first())
            _3 = math.abs(volatility[i] - cmean.first())
            if _1 < _2 and _1 < _3
                hv.unshift(volatility[i])

            if _2 < _1 and _2 < _3
                mv.unshift(volatility[i])

            if _3 < _1 and _3 < _2
                lv.unshift(volatility[i])

        amean.unshift(hv.avg())
        bmean.unshift(mv.avg())
        cmean.unshift(lv.avg())
        size_a := hv.size()
        size_b := mv.size()
        size_c := lv.size()
        iterations := iterations + 1

hv_new = amean.first()
mv_new = bmean.first()
lv_new = cmean.first()
vdist_a = math.abs(volatility - hv_new)
vdist_b = math.abs(volatility - mv_new)
vdist_c = math.abs(volatility - lv_new)

distances = array.new_float()
centroids = array.new_float()

distances.push(vdist_a)
distances.push(vdist_b)
distances.push(vdist_c)

centroids.push(hv_new)
centroids.push(mv_new)
centroids.push(lv_new)

cluster = distances.indexof(distances.min()) // 0 for high, 1 for medium, 2 for low
assigned_centroid = cluster == -1 ? na : centroids.get(cluster)

[ST, dir] = pine_supertrend(fact, assigned_centroid)
upTrend = plot(close > ST ? ST : na, color = color.new(green, t1), style = plot.style_linebr) //, force_overlay = true
downTrend = plot(close < ST ? ST : na, color = color.new(red, t1), style = plot.style_linebr, force_overlay = false) //, force_overlay = true
bodyMiddle = plot(barstate.isfirst ? na : (open + close) / 2, "Body Middle",display = display.none)

fill(bodyMiddle, upTrend, (open + close) / 2, ST, color.new(green, t2), color.new(green, t1))
fill(bodyMiddle, downTrend, ST, (open + close) / 2, color.new(red, t1), color.new(red, t2))

plotshape(ta.crossunder(dir, 0) ? ST : na, "Bullish Trend", shape.labelup, location.absolute, green, text = "▲", textcolor = chart.fg_color, size = size.small)
plotshape(ta.crossover(dir, 0) ? ST : na, "Bearish Trend", shape.labeldown, location.absolute, red, text = "▼", textcolor = chart.fg_color, size = size.small)

label.new(bar_index, dir > 0 ? ST + ta.atr(7) : ST - ta.atr(7), text = str.tostring(4 - (cluster + 1)), style = label.style_none, textcolor = color.from_gradient(cluster + 1, 1, 3, color.new(dir > 0 ? red : green, 30), color.new(dir > 0 ? red : green, 90)))

if barstate.islast
    var data_table = table.new(position=position.top_right, columns=4, rows=4, bgcolor = chart.bg_color, border_width=1, border_color = chart.fg_color, frame_color = chart.fg_color, frame_width = 1)
    table.cell(data_table, text_halign=text.align_center, column=0, row=0, text="Cluster Number (Volatility Level)", text_color = chart.fg_color)
    table.cell(data_table, text_halign=text.align_center, column=1, row=0, text="Cluster Centroid (ATR)", text_color = chart.fg_color)
    table.cell(data_table, text_halign=text.align_center, column=2, row=0, text="Cluster Size (No. of Data Points in Each Cluster)", text_color = chart.fg_color)
    table.cell(data_table, text_halign=text.align_center, column=3, row=0, text="Current Volatility", text_color = chart.fg_color)

    table.cell(data_table, text_halign=text.align_center, column=0, row=1, text="3 (High)", text_color = chart.fg_color)
    table.cell(data_table, text_halign=text.align_center, column=0, row=2, text= "2 (Medium)", text_color = chart.fg_color)
    table.cell(data_table, text_halign=text.align_center, column=0, row=3, text= "1 (Low)", text_color = chart.fg_color)

    table.cell(data_table, text_halign=text.align_center, column=1, row=1, text=str.format("{0,number,#.##}", hv_new), text_color = chart.fg_color)
    table.cell(data_table, text_halign=text.align_center, column=1, row=2, text=str.format("{0,number,#.##}", mv_new), text_color = chart.fg_color)
    table.cell(data_table, text_halign=text.align_center, column=1, row=3, text=str.format("{0,number,#.##}", lv_new), text_color = chart.fg_color)

    table.cell(data_table, text_halign=text.align_center, column=2, row=1, text=str.format("{0,number,#.##}", size_c), text_color = chart.fg_color)
    table.cell(data_table, text_halign=text.align_center, column=2, row=2, text=str.format("{0,number,#.##}", size_b), text_color = chart.fg_color)
    table.cell(data_table, text_halign=text.align_center, column=2, row=3, text=str.format("{0,number,#.##}", size_a), text_color = chart.fg_color)

    table.cell(data_table, text_halign=text.align_center, column=3, row=1, text="HIGH " + "(ATR: " + str.format("{0,number,#.##}", volatility) + ")", text_color = chart.bg_color)
    table.cell(data_table, text_halign=text.align_center, column=3, row=2, text="MEDIUM " + "(ATR: " + str.format("{0,number,#.##}", volatility) + ")", text_color = chart.bg_color)
    table.cell(data_table, text_halign=text.align_center, column=3, row=3, text="LOW " + "(ATR: " + str.format("{0,number,#.##}", volatility) + ")", text_color = chart.bg_color)

    if cluster == 0
        data_table.cell_set_bgcolor(3, 1, chart.fg_color)
    else
        data_table.cell_set_bgcolor(3, 1, chart.bg_color)

    if cluster == 1
        data_table.cell_set_bgcolor(3, 2, chart.fg_color)
    else
        data_table.cell_set_bgcolor(3, 2, chart.bg_color)

    if cluster == 2
        data_table.cell_set_bgcolor(3, 3, chart.fg_color)
    else
        data_table.cell_set_bgcolor(3, 3, chart.bg_color)

////////////////////////////Alerts
alertcondition(ta.crossunder(dir, 0) and barstate.isconfirmed, "Bullish Trend Shift")
alertcondition(ta.crossover(dir, 0) and barstate.isconfirmed, "Bearish Trend Shift")
alertcondition(cluster == 0 and cluster[1] != 0 and barstate.isconfirmed, "High Volatility")
alertcondition(cluster == 1 and cluster[1] != 1 and barstate.isconfirmed, "Medium Volatility")
alertcondition(cluster == 2 and cluster[1] != 2 and barstate.isconfirmed, "Low Volatility")
alertcondition(cluster == 2 and cluster[1] != 2 and barstate.isconfirmed, "Low Volatility")
Code locked
Sign in to view & copy
You can browse scripts freely. Creating an account unlocks the code.
Installation
Same instructions, updated shell styling.
Tip: Press Esc to go back to Scripts.